FTSE rises after PBOC cuts rates. USD/CAD falls, but is a reversal on the cards?
Share:
FTSE rises after PBOC cuts rates
The FTSE, along with its European peers are moving higher after the PBOC cut interest rates overnight.
The 10-basis point cut is the first by the Chinese central bank is the first move to cut rates in 2 years and is boosting market sentiment.
The move came after Chinese GDP rose by 1.6% QoQ in Q4, beating forecasts. However, retail sales growth disappointed.
The move by the PBOC has boosted metal prices, lifting the FTSE, which is outperforming its peers, despite concerns over Boris Johnson’s future.
US equity markets are shut for Martin Luther King Day so trading volumes could slow after lunch.
Where next for FTSE?
The FTSE is extending gains from the late November low, retaking the 50 & 100 sma before hitting resistance at 5774. The index trades at the upper band of a rising wedge, however, the bullish RSI points to further upside whilst the index remains out of overbought territory.
Buyers will be looking for a move over 5775 and above the upper band at 7590 for fresh post -pandemic highs.
Sellers will be looking a move 7424 last week’s low to negate the near-term uptrend.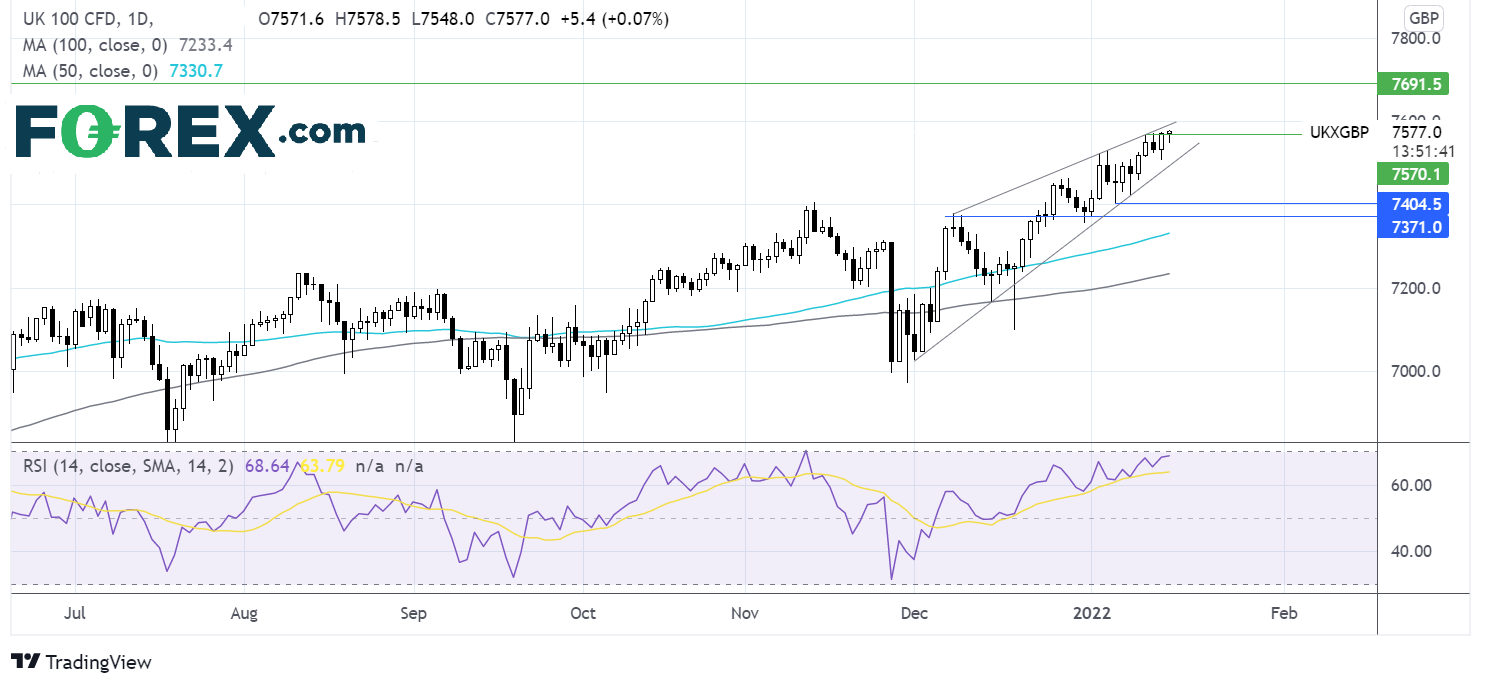
USD/CAD falls, but is a reversal on the cards?
USD/CAD is falling lower at the start of the week, building on losses from the previous week.
USD/CAD dropped to a 2 month low on Thursday, but closed higher on Friday despite disappointing US retail sales data & a surging oil prices.
Oil rallied 6.5% across last week and in om the rise again today amid concerns over the ability of OPEC+ countries to reach higher output targets.
However, the Omicron situation in Canada, which is quite serious, with tighter restrictions being imposed could hurt demand for the CAD.
With the US closed for a public holiday. Oil prices and Canadian manufacturing data are expected to be the principle driver of USD/CAD today.
Where next for USD/CAD?
USD/CAD has extended its decline from 1.2963 reached in late December, finding support on the multi-month rising trendline at 1.2460 last week just below the 200 sma.
The price has pushed back over the 200 sma, which combined with the hammer candle stick pattern and a receding bearish bias on the MACD suggests that a move higher could be on the cards.
Buyers could look for a move over 1.26, the early November high, in order to target further gains towards the 50 sma at 1.27.
Sellers could look for a move below the 200 sma at 1.2490 and 1.2460 last week’s low for further losses towards 1.24 November 10 low.